Operating Playbook
How I Stabilize, Scale, and Prepare Industrial Platforms for Growth and Exit
I approach each platform investment with a structured operating framework designed to rapidly establish financial clarity, align leadership, install operating discipline, and accelerate revenue growth. While each situation is unique, the core principles of governance, accountability, customer focus, and capital discipline remain constant.


Business Integration Framework
Integration Experience (Examples):
Cross-border consolidation (Europe) | Competitor acquisition integration (Data Display–DUCO) | Adjacent-market roll-up (MetWeld) | Multi-division consolidation (Davlyn Group)
Each required a structured, financially grounded integration plan with clear governance, KPI tracking, and cultural alignment.
Successful integration requires disciplined alignment of strategy, operations, culture, and capital, with clear governance and measurable accountability.
Disciplined Business Integration
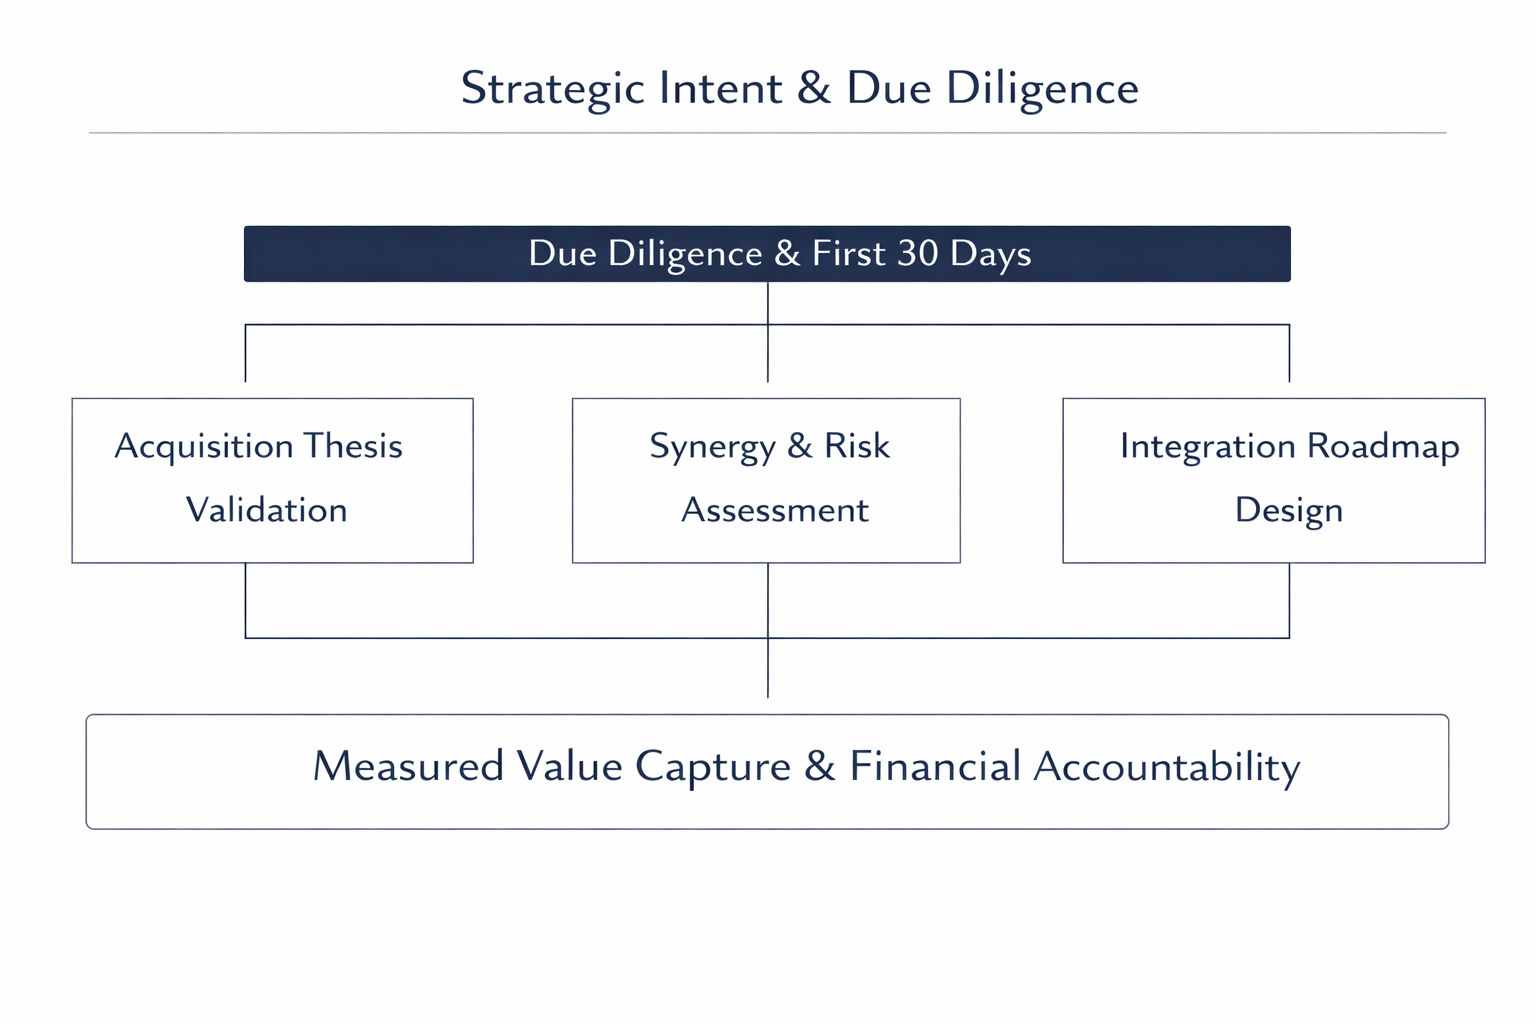
Strategic Intent & Due Diligence
Integration starts in due diligence or, when I’m joining a platform, in the first 30 days of my 90-day plan. In both cases, the early focus is to validate the thesis, surface risks, and establish the integration roadmap and governance.
Thesis Alignment:
Revenue expansion | Margin improvement | Customer diversification | Engineering capability expansion | Supply chain leverage | Operational consolidation | Pricing Discipline
First 30-Day Focus:
Synergy validation | Risk assessment | Cultural baseline | Governance structure | Integration roadmap design
Integration is successful only when execution advances the original investment thesis and produces measurable financial outcomes.
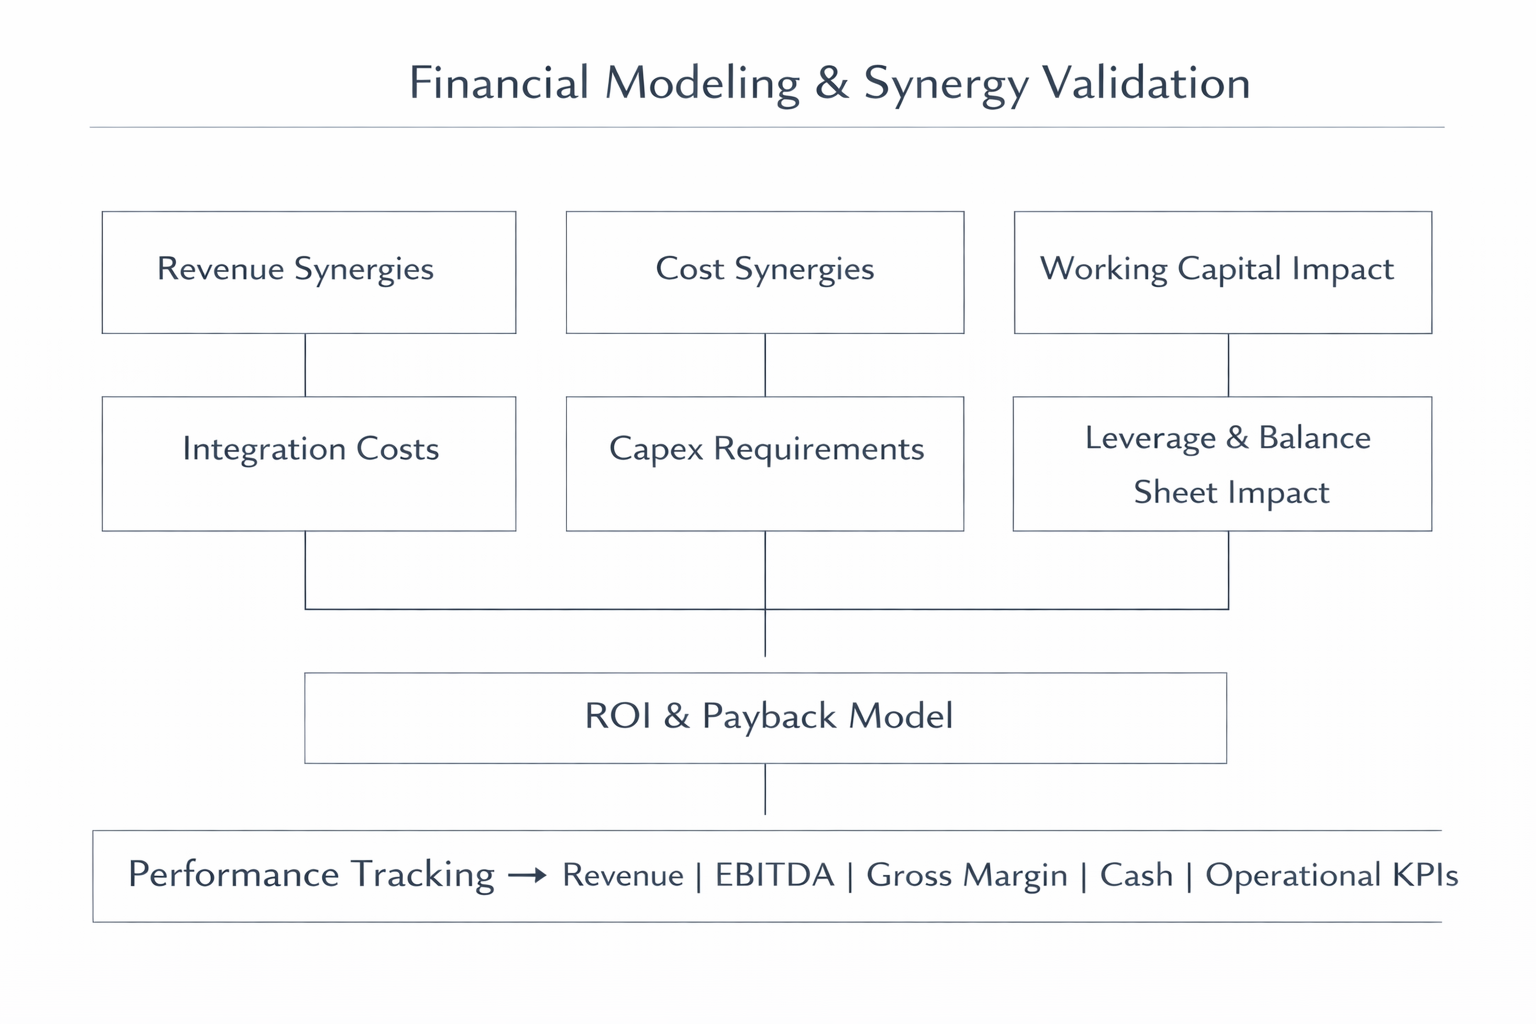
Financial Modeling & Synergy Validation
Before execution begins, we build a clear integration model and define measurable targets across the income statement, balance sheet, and cash flow.
Integration Model Inputs:
Revenue synergies | Cost synergies | Working capital impact | Leverage implications | One-time integration costs | Capex requirements | ROI and payback
Tracking & Accountability:
Revenue | EBITDA and gross margin | Balance sheet and cash metrics | Operational KPIs
Integration success is validated through measured performance and value capture tracking, not assumptions.
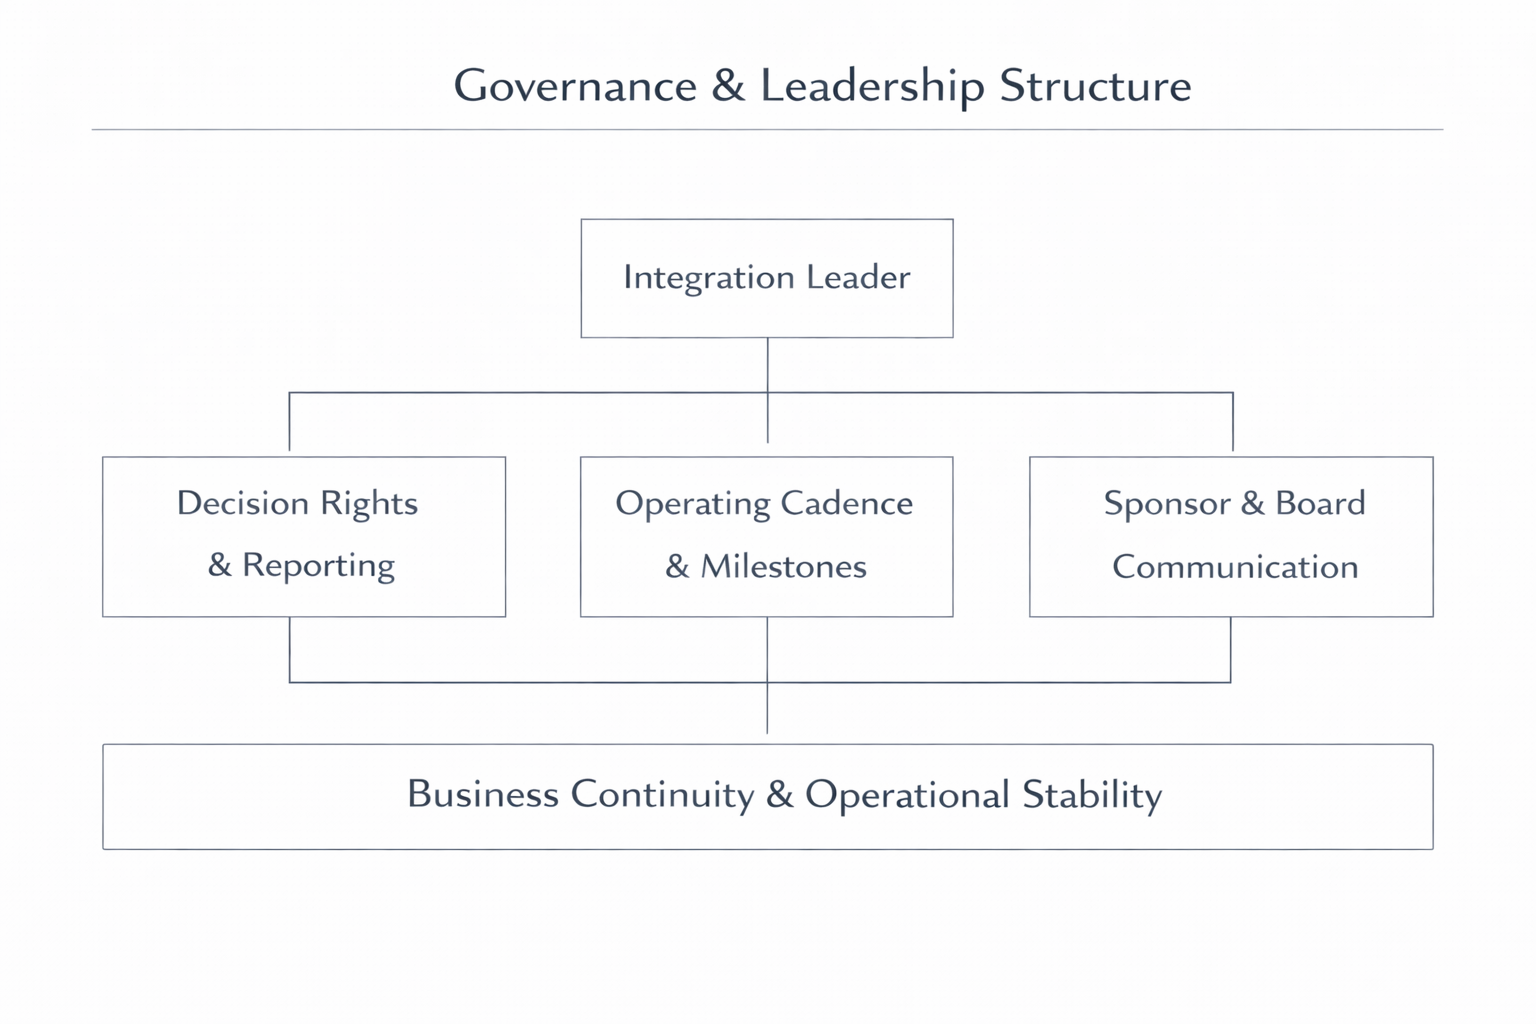
Governance & Leadership Structure
Integration requires clear ownership, decision rights, and operating cadence so the core business continues to perform during transition.
Governance Setup:
Integration leader/team | Decision rights & reporting | Operating cadence & milestone tracking | Sponsor/Board communication
Business Continuity:
Protect day-to-day execution | Customer continuity plan | Capacity and service-level protection
The objective is disciplined integration without disrupting ongoing performance.
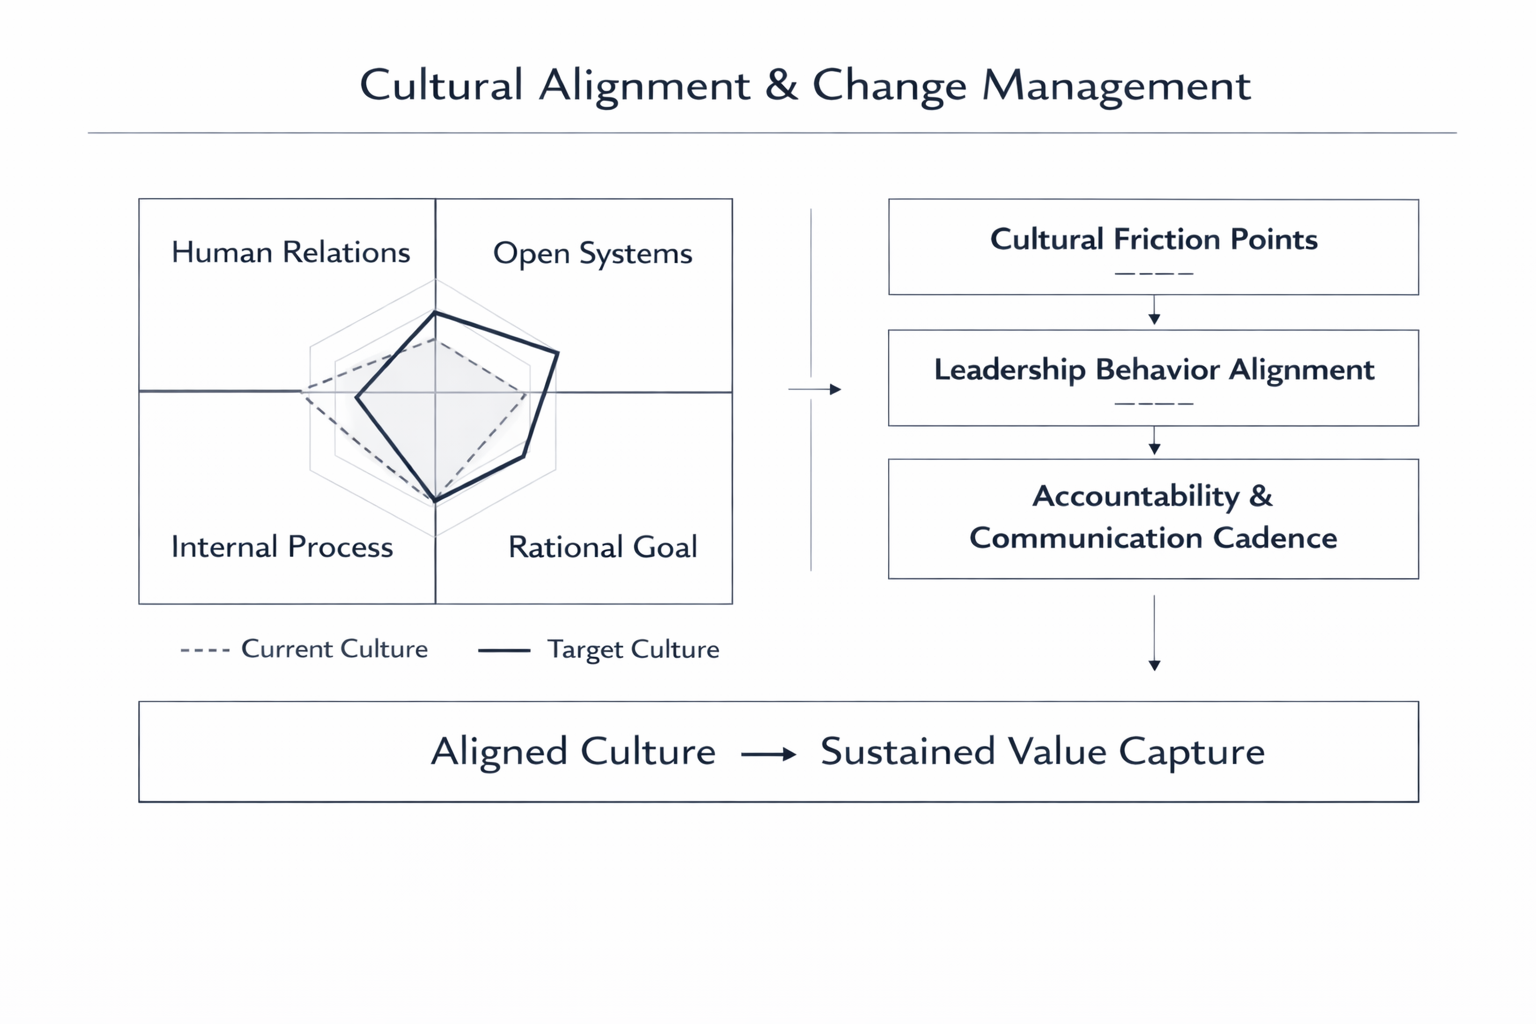
Cultural Alignment & Change Management
Cultural alignment is a measurable component of integration and is evaluated using the Competing Values Framework to define current and target operating norms.
Cultural Assessment:
Current vs target culture | Subculture identification | Cultural friction points | Risk mapping
Leadership Alignment:
Defined leadership behaviors | Decision-making norms | Accountability standards | Communication cadence
Execution Focus:
Reinforce desired behaviors | Align incentives | Monitor adoption | Adjust course as needed
Misalignment at the cultural level can erode integration value more quickly than operational inefficiencies.
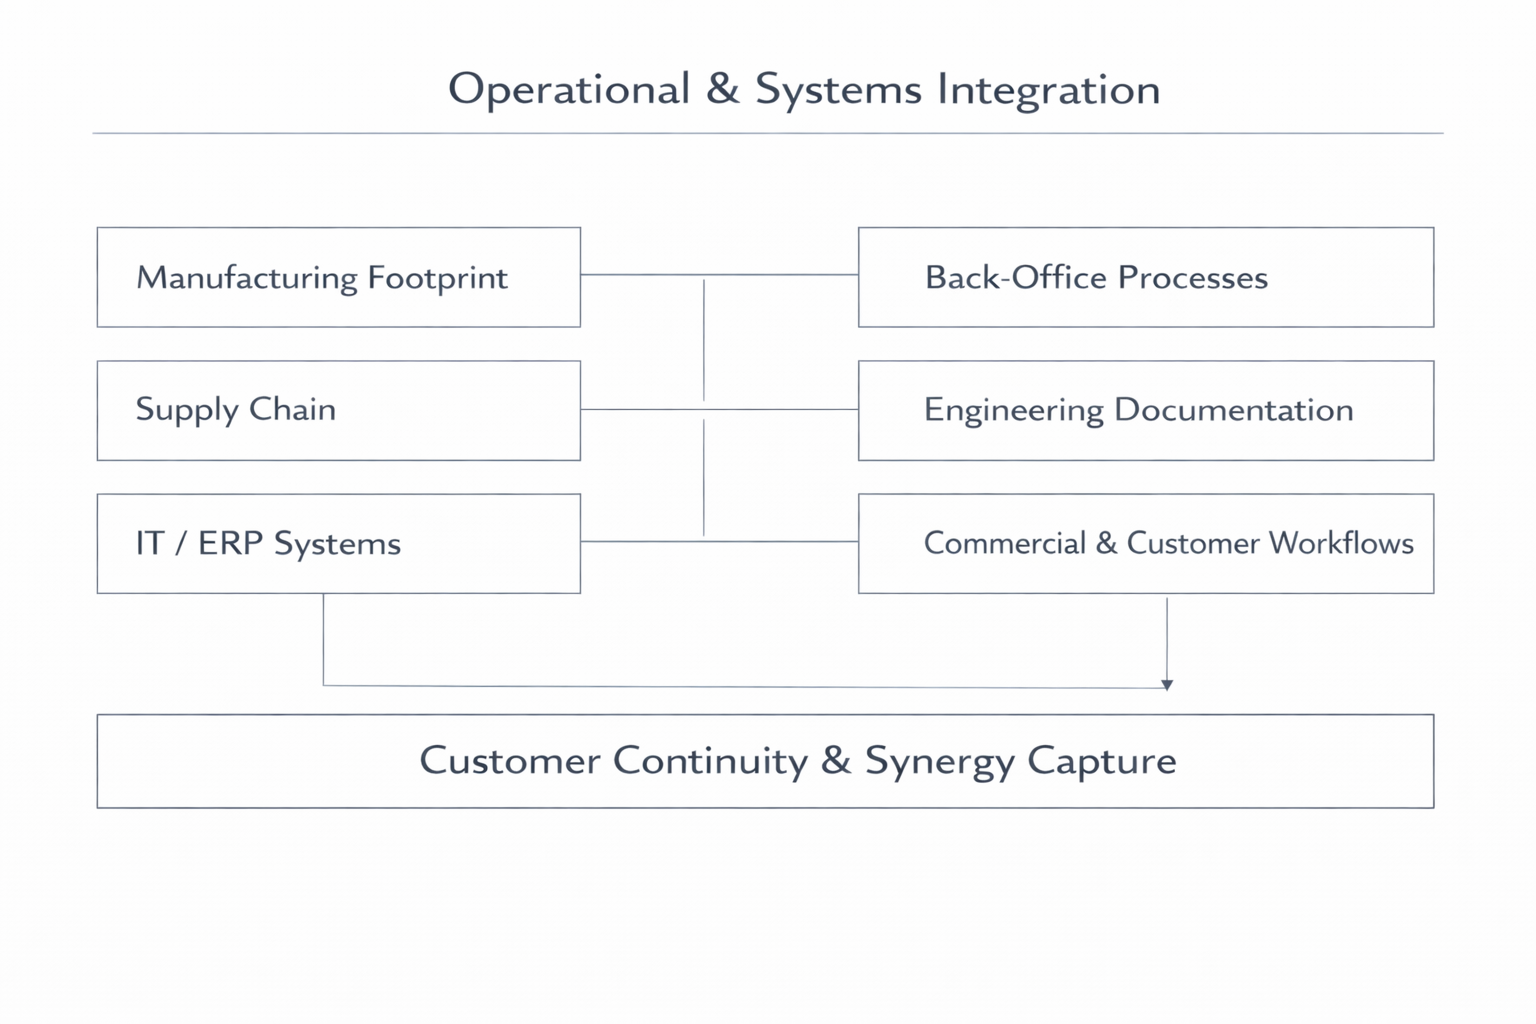
Operational & Systems Integration
Operational integration focuses on harmonizing core processes and systems while protecting customer continuity and day-to-day execution.
Integration Scope:
Manufacturing footprint | Supply chain | Back-office processes | IT/ERP systems | Engineering documentation | Commercial and customer-facing workflows
Customer Continuity:
Protect key relationships | Stage transitions and cutovers | Safety stock where required | Monitor lead times, service levels, and fulfillment performance
The goal is seamless operational integration that protects customers while capturing planned synergies.
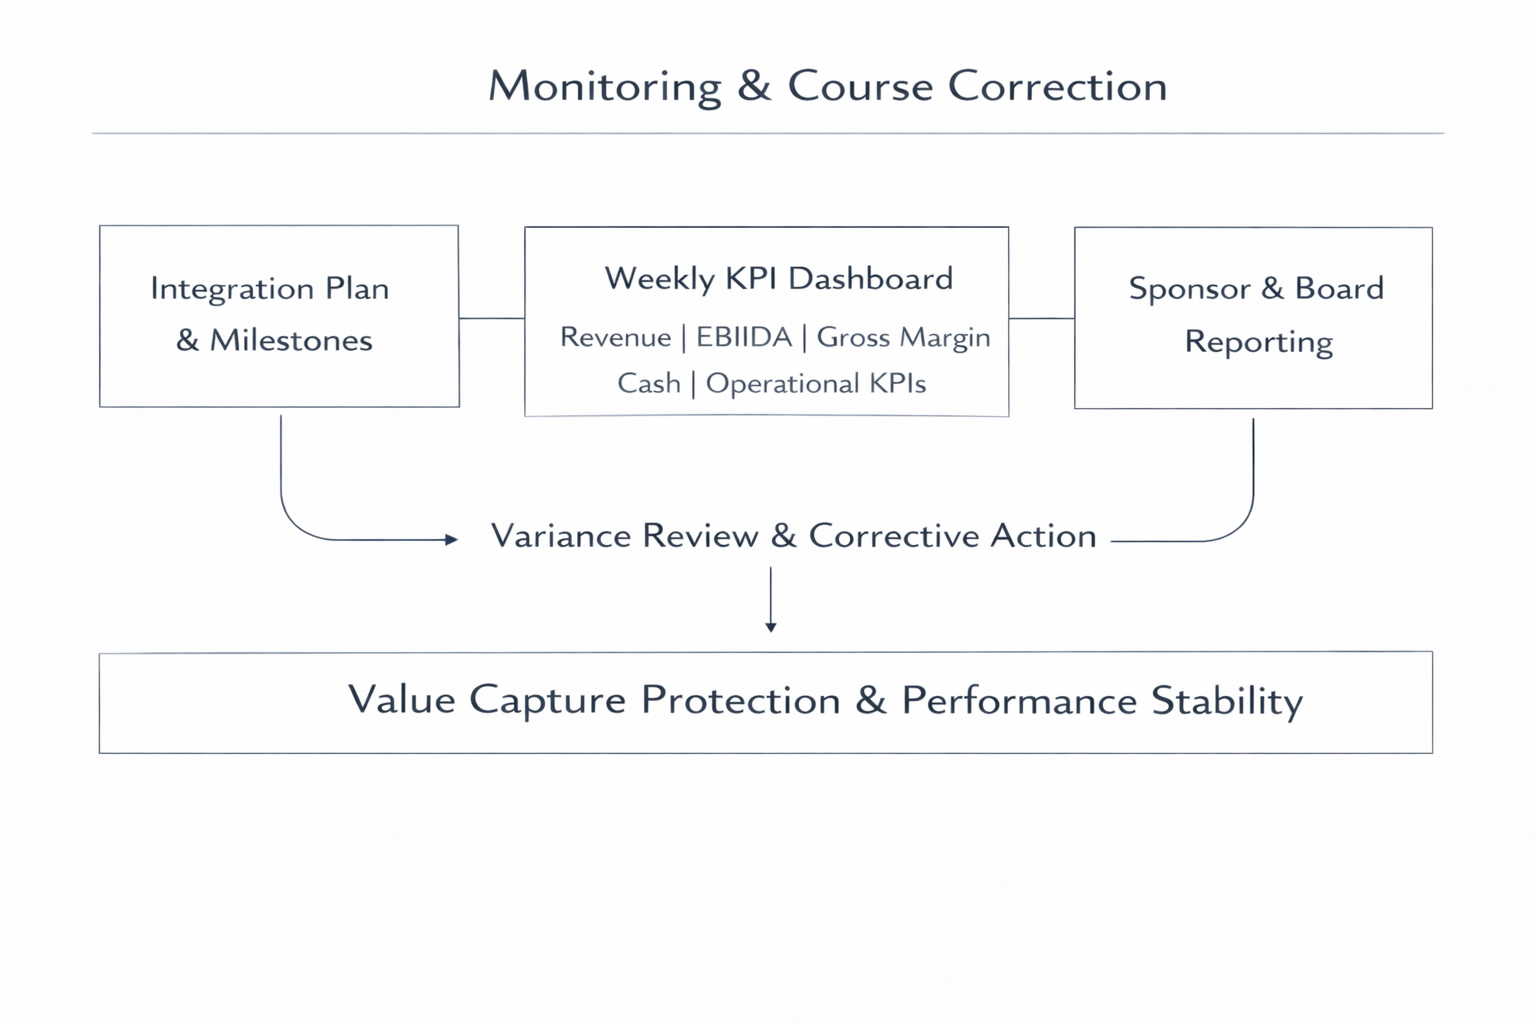
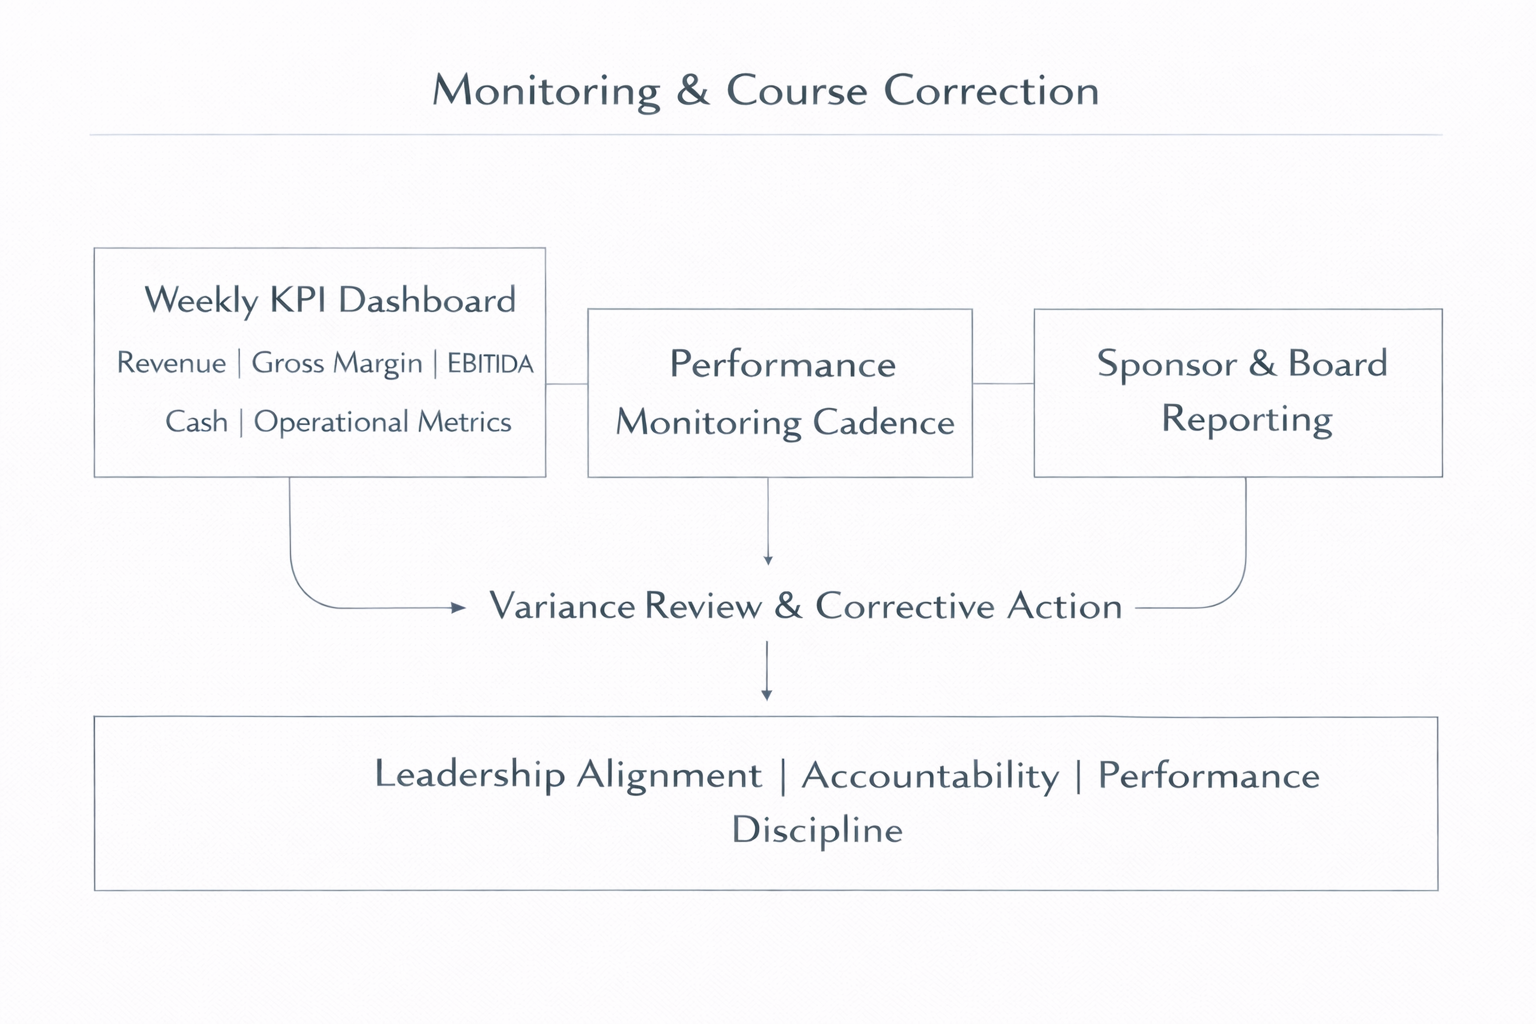
Monitoring & Course Correction
Integration value is protected through structured tracking, clear reporting, and early intervention when performance or milestones drift.
Tracking & Reporting:
Weekly KPI dashboard | Monthly sponsor reporting | Milestone tracking | Risk identification and mitigation
The objective is early course correction that protects customers, maintains operating performance, and ensures value capture stays on plan.
Integration Philosophy
Integration is a capital allocation exercise grounded in disciplined execution and measurable accountability.
Principles:
Thesis alignment | Financial modeling | Governance clarity | Cultural alignment | Operational discipline | Continuous monitoring
The objective is sustained enterprise value creation through structured integration and accountable performance.
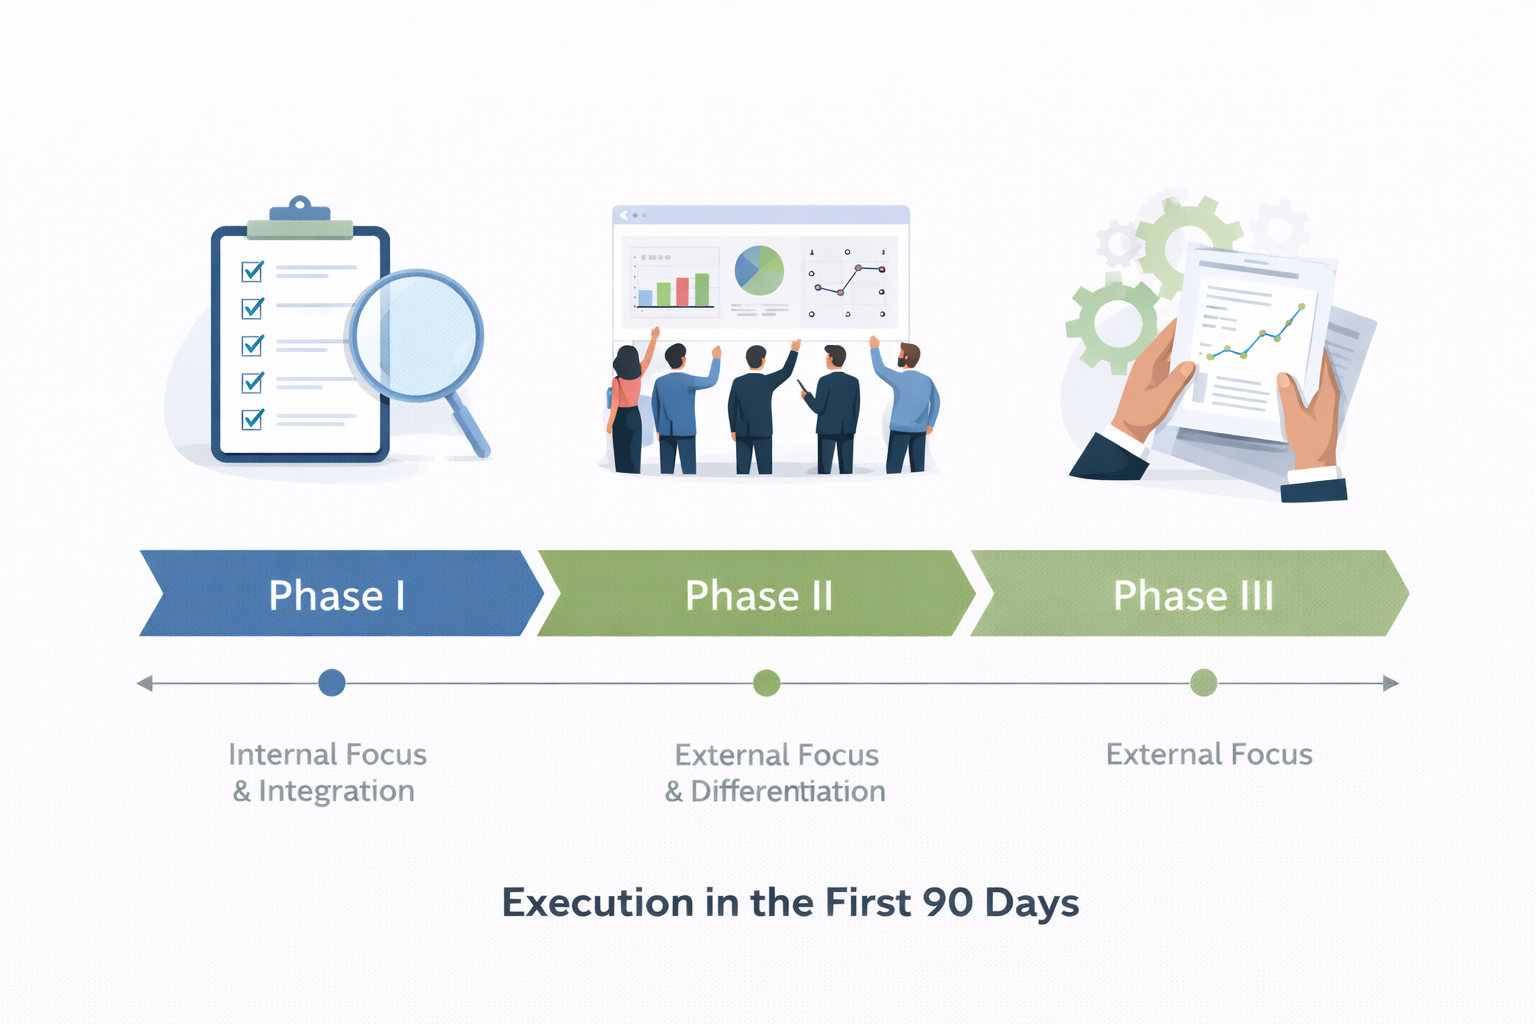
First 90 Days: Structured Assimilation & Execution
Phase I – Diagnose, Listen & Establish Baseline (Days 1–30)
Meet with top customers to understand value drivers, pricing power, service gaps, and competitive dynamics
Conduct leadership alignment sessions and assess organizational capability
Review EBITDA trends, cash flow performance, and working capital position with finance leadership; ensure near-term liquidity visibility and forecasting discipline
Assess pricing discipline, customer concentration, backlog quality, and pipeline integrity
Conduct operational, safety, and quality review
Perform cultural audit (current vs. desired behaviors, accountability, and decision-making norms)
Identify immediate liquidity, margin, and operational improvement opportunities
Begin building the Technology & Product Roadmap inputs through an Environmental Scan, SWOT analysis and an 8-criteria evaluation framework.
Objective: Establish financial and commercial clarity while defining the strategic starting point.
Phase II – Install Operating Discipline & Strategic Alignment (Days 30–60)
Finalize the 12–24 month value creation thesis aligned with sponsor expectations
Install KPI dashboard (Revenue, Gross Margin, EBITDA, Cash, Utilization, Backlog, Pipeline)
Begin instilling pricing discipline through deal review cadence, margin thresholds, and improving pipeline and forecast rigor
Establish operating cadence (weekly execution reviews; monthly performance and variance accountability)
Clarify leadership roles, decision rights, and performance expectations
Tighten working capital discipline with finance leadership (AR, inventory, payables, billing cadence)
Finalize cultural audit findings and translate them into a practical change plan (target behaviors, leadership routines, communication cadence, and accountability mechanisms)
Develop and prioritize the Technology & Product Roadmap based on customer input, Environmental Scan, SWOT findings, and 8-criteria evaluation framework; define ROI gates, resourcing, ownership, and milestones
Launch early revenue acceleration initiatives (pricing, pipeline rigor, channel/partner actions)
Objective: Transition from diagnosis to disciplined, accountable execution.
Phase III – Accelerate Growth & Strategic Execution (Days 60–90)
Execute pricing, channel, and strategic partnership initiatives to drive revenue expansion
Advance Lean and operational efficiency programs to improve margin and throughput
Begin execution of prioritized Technology & Product Roadmap initiatives with defined milestones and ROI tracking
Align product, operations, and commercial teams around roadmap delivery and market impact
Evaluate acquisition criteria and adjacency opportunities, where applicable
Assess automation, digital enablement, and AI applications to improve operating leverage and decision support
Align forward-looking strategy with ownership’s capital deployment and exit objectives
Objective: Move from stabilization to scalable, measurable growth.


Cultural Audit and Alignment
Data-Driven Culture Assessment Using the Competing Values Framework
While many organizations discuss culture in abstract terms, I treat culture as a measurable operating variable.
I use the Competing Values Framework (Quinn & Rohrbaugh) to assess current culture, identify subcultures, and define the target cultural profile required to execute strategy.
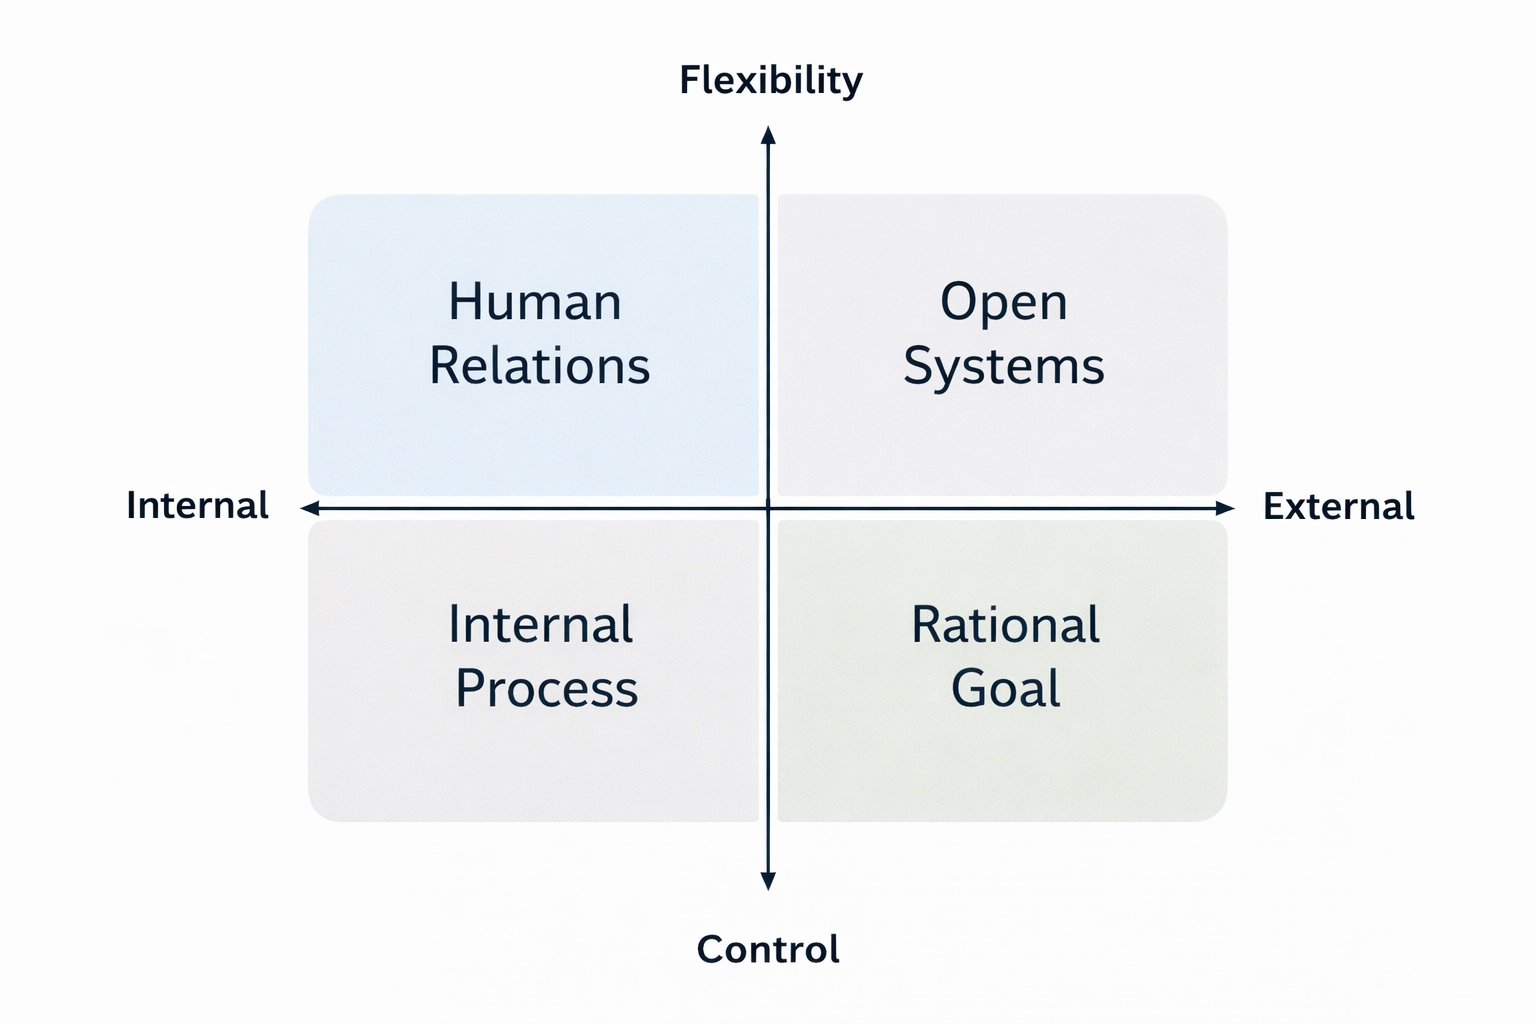
The Framework
The Competing Values Model evaluates culture across two core dimensions:
Internal vs. External Focus
Flexibility vs. Control
This creates four culture archetypes:
Open Systems – Innovation, adaptability, external opportunity (Google, Apple)
Rational Goal – Results, productivity, goal clarity (General Electric, Amazon)
Internal Process – Stability, structure, process discipline (McDonald’s, Toyota)
Human Relations – Team cohesion, development, engagement (Starbuck’s, Southwest Airlines)
Each quadrant reflects both:
Means (how work is approached)
Ends (how success is measured)
This allows leadership to identify whether the organization’s operating behaviors align with strategic objectives.
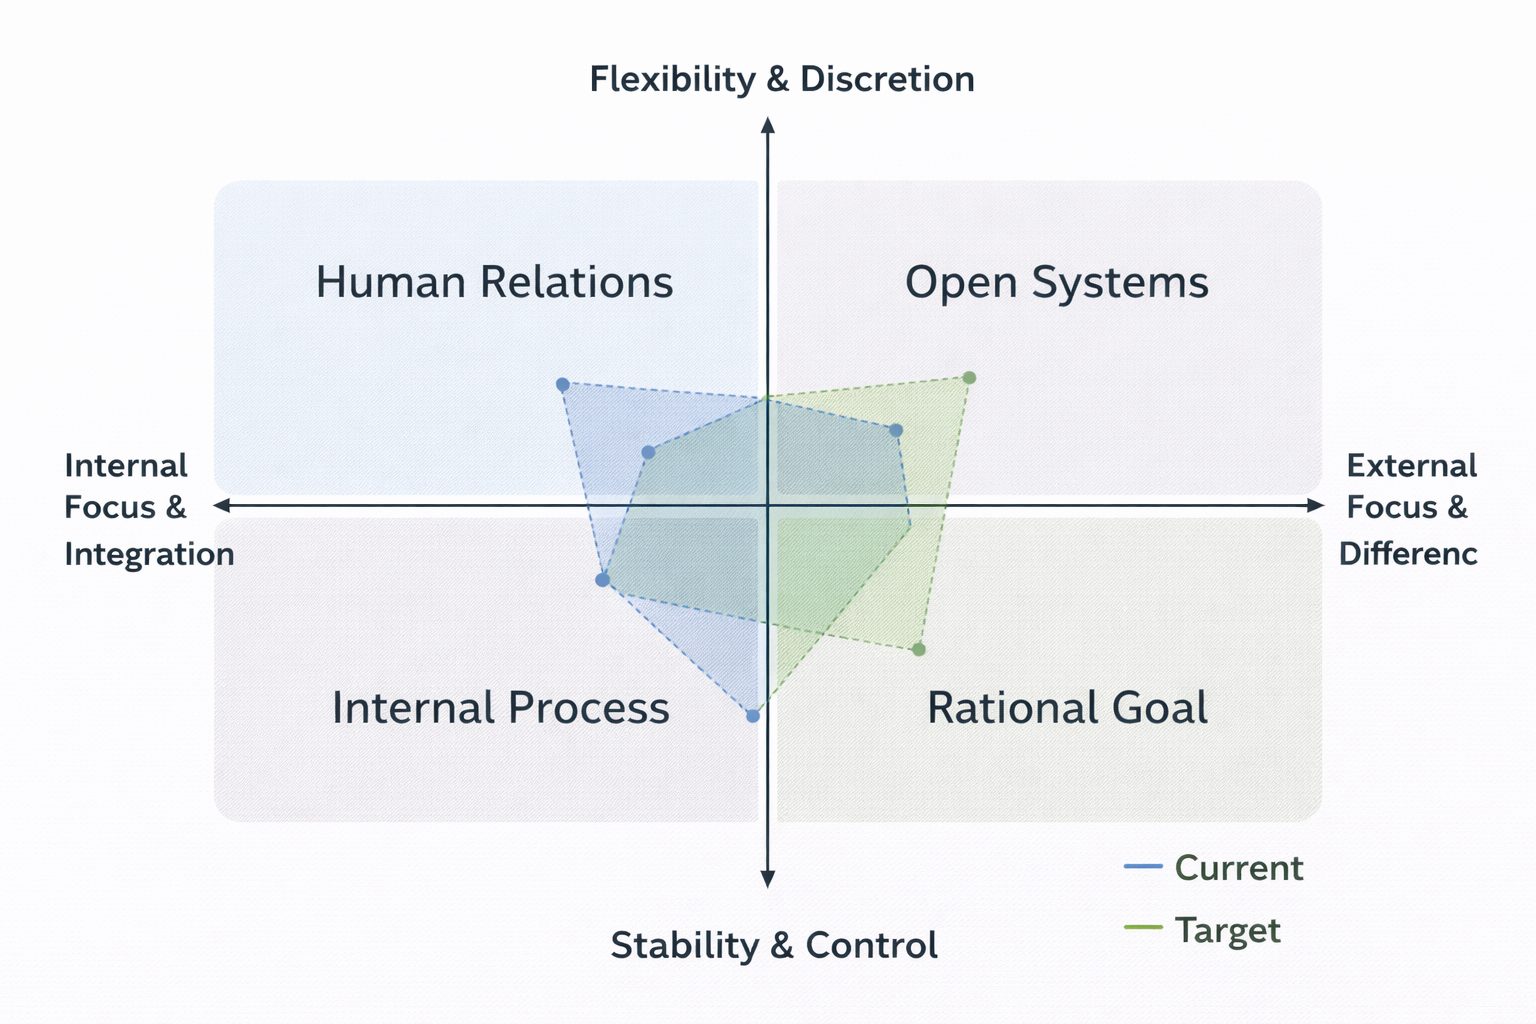
How I Apply It
Deploy structured assessment across leadership and functional groups
Analyze results across defined measurement cells (flexibility, planning, productivity, information flow, stability, cohesion, skill depth, etc.)
Identify dominant culture and subcultures
Define the required cultural profile to support strategy
Visualize findings through an ameba-gram comparison (Current vs. Target)
The visual output aligns leadership around facts — not opinions.
Why This Matters
A growth strategy requires a different cultural mix than a stabilization strategy
A Lean manufacturing mandate requires different behaviors than a product innovation push
M&A integration requires understanding subculture conflict risk
Culture is not “soft.” It is a structural performance driver.
Execution in the First 90 Days
Phase I: Conduct assessment and gather data
Phase II: Finalize findings and translate into change plan
Phase III: Embed behaviors into KPI cadence, decision rights, leadership routines, and performance management
The objective is alignment between strategy, operating model, and behavior.
Technology and Product Development Roadmap
Disciplined, Nimble, Capital-Allocation Driven
Traditional Stage-Gate processes can be bureaucratic and slow. In lower-middle-market industrial businesses, speed, clarity, and ROI matter more than ceremony.
I use a structured but nimble product investment process that prioritizes market attractiveness, customer pull, and execution feasibility. This framework has produced defensible IP—including two U.S. patents across two distinct industries—demonstrating its ability to convert disciplined evaluation into tangible enterprise value.
Objective: Allocate capital and engineering resources to the opportunities with the highest ROI and strategic advantage.
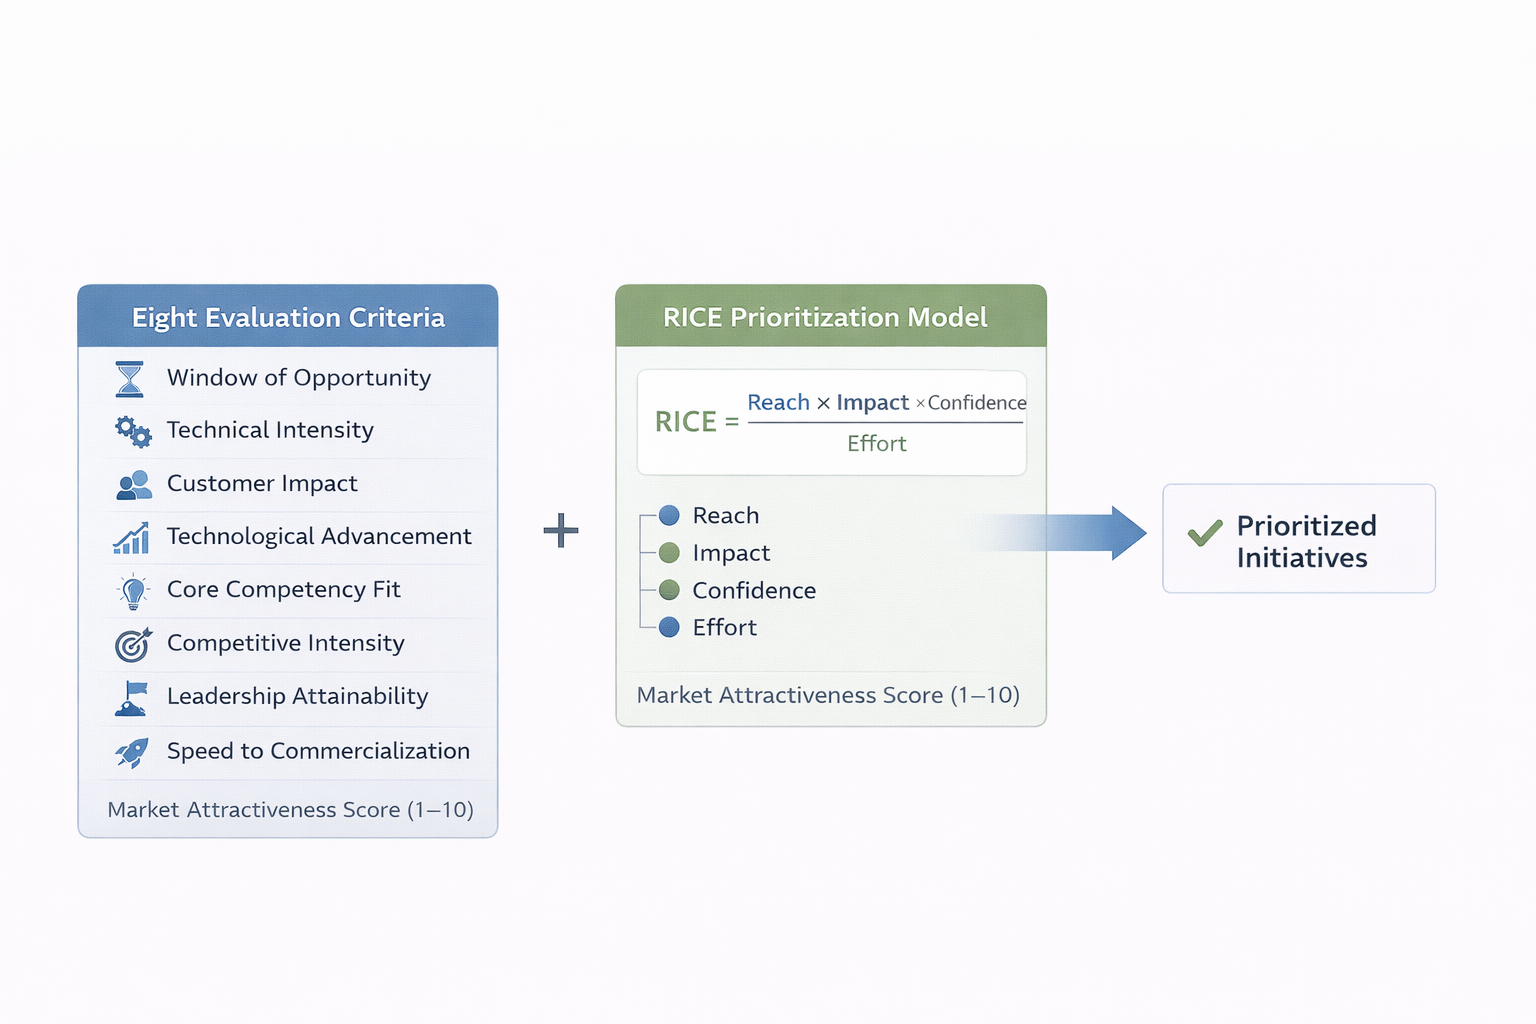
Step 1: Evaluate Current Opportunities
Every product development initiative is evaluated using:
Eight Market Attractiveness Criteria
Window of opportunity (opening, open, closing, closed)
Does the market or opportunity have a high technical component
Impact on customer’s end product
Is the technology constantly advancing
Fit with core competencies
Competitive intensity / niche positioning
Attainability of leadership position
Speed to commercialization
Each opportunity receives a Market Attractiveness score (1–10).
RICE Prioritization Model
RICE=(Reach × Impact × Confidence) ÷ Effort
Reach: Addressable customer base or revenue potential
Impact: Revenue, margin, or strategic differentiation
Confidence: Certainty in assumptions
Effort: Total resource investment required
This prevents emotional or anecdotal investment decisions.
Step 2: Evaluate Markets & Adjacencies
Scope Assessed:
Core Markets | Adjacent Markets | Emerging Segments
Method:
PESTEL Environmental Scan — Political | Economic | Social | Technological | Environmental | Legal
Output:
Regulatory shifts | Demand trends | Competitive dynamics | Structural risks & opportunities
This identifies regulatory shifts, customer demand trends, capital intensity changes, and structural threats or opportunities.
Step 3: Cross-Functional Alignment
Inputs Distributed:
Engineering | Operations | Sales | Finance | Management
Shared Framework:
SWOT | Market Attractiveness | 8 Criteria + RICE
Roadmap Session Outcome:
Short-Term Revenue (≤ 12 months) | Long-Term Strategic Bets (> 12 months) | Required M&A | Required Internal Development
This is not brainstorming. It is disciplined capital allocation.
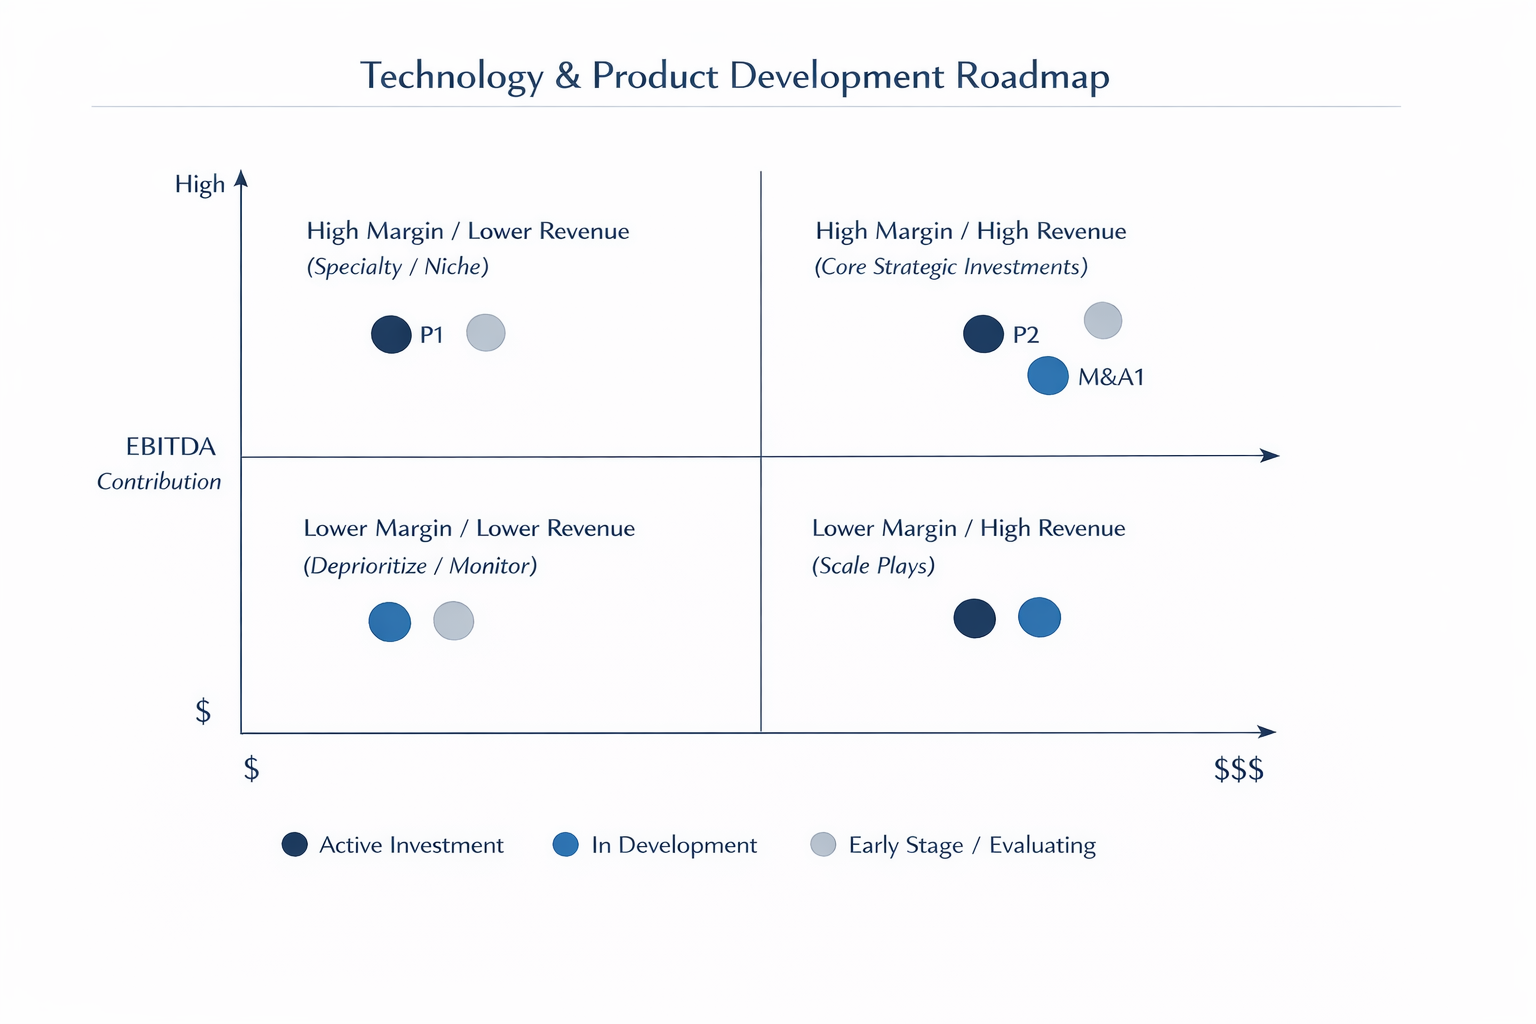
Step 4: Roadmap Visualization
Portfolio View:
Margin vs Revenue Potential | Completed vs In-Process vs New / Evaluating
Prioritization:
Clear capital allocation by quadrant and stage
Execution Output:
Resourcing | Sequencing | Customer champions | Implementation plans
Key Differentiators of My Approach
Faster than traditional Stage-Gate
Retains customer champion discipline
Integrates strategy, market data, and execution feasibility
Aligns engineering investment to capital objectives
Enables visibility for sponsors and Board plans
How This Fits in the First 90 Days
Phase I: Environmental Scan + SWOT + Opportunity Screen
Phase II: Prioritize, assign ownership, define ROI gates
Phase III: Begin execution of top initiatives
Turnaround Playbook
Turnarounds require fast clarity, disciplined execution, and transparent communication. I focus on stabilizing cash and operations first, then rebuilding performance through operating discipline, cultural alignment, and a clear go-forward strategy.
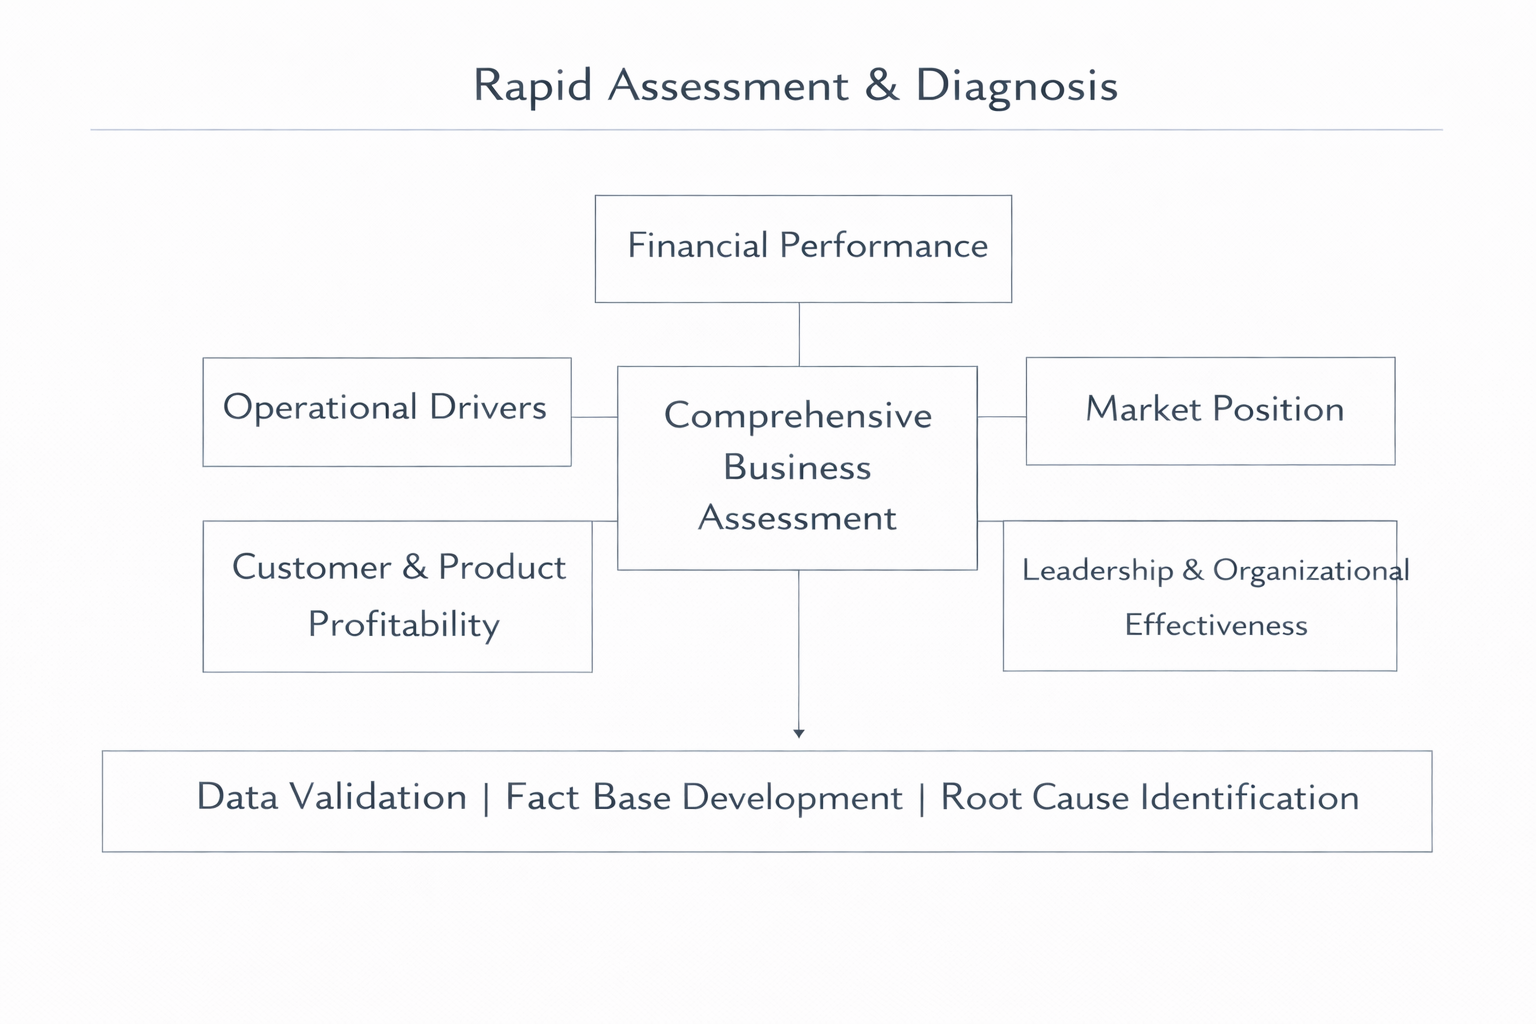
Rapid Assessment & Diagnosis
The first step is a comprehensive assessment across financial performance, operational drivers, market position, customer health, and leadership effectiveness.
Focus Areas:
Financial and margin bridge | Customer and product profitability | Capacity and constraints | Quality and service performance | Organizational effectiveness
A turnaround plan is only as good as the diagnosis it is built on.
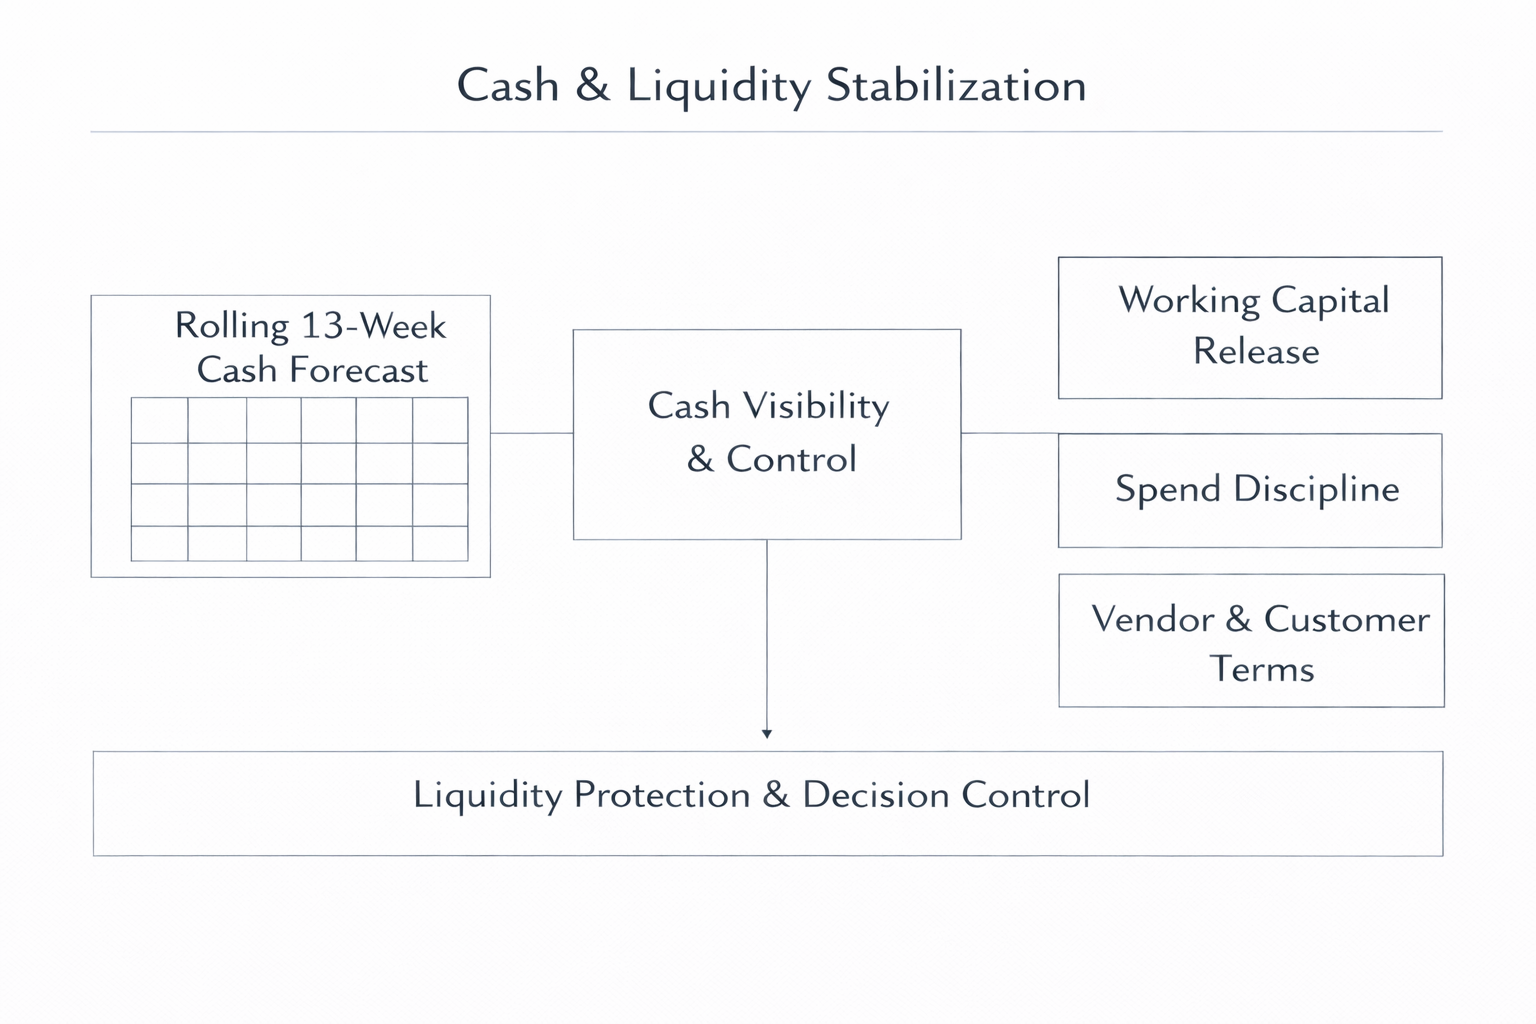
Cash & Liquidity Stabilization
In stressed situations, liquidity control creates options. I work with the finance team to establish short-interval cash visibility and spending discipline, typically anchored by a rolling 13-week cash forecast.
Focus Areas:
Cash forecasting cadence | Working capital release | Spend controls | Vendor and customer terms | Borrowing base discipline
Stabilizing cash buys time and restores decision-making control.
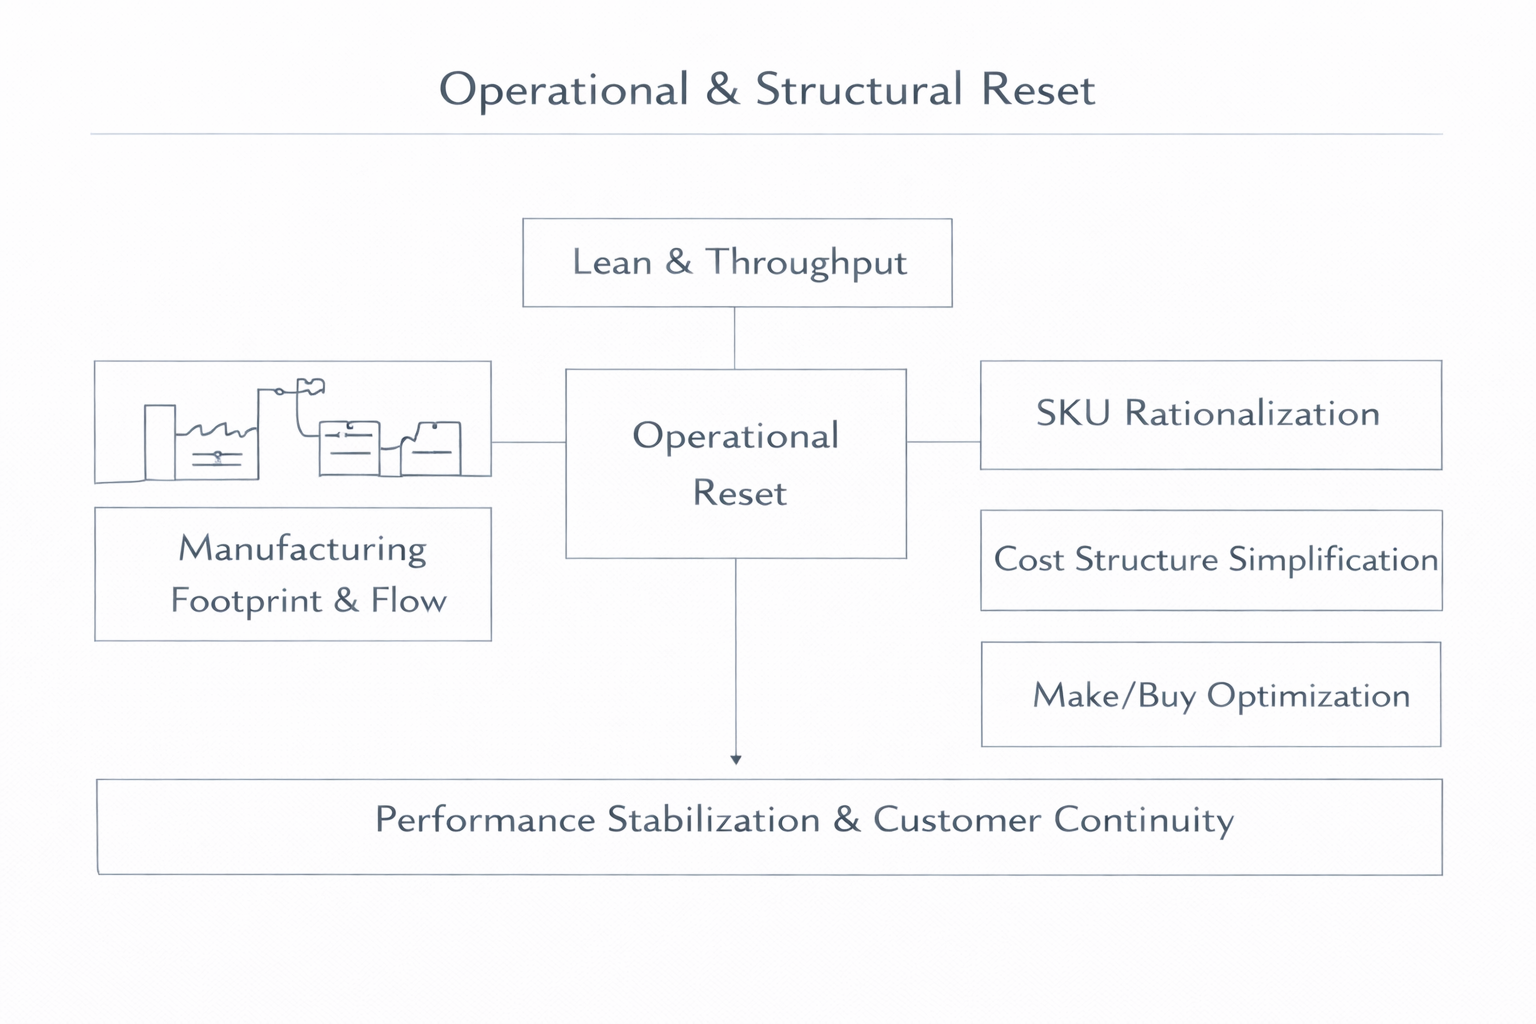
Operational & Structural Reset
Once liquidity is under control, I prioritize measurable operational improvement and structural simplification. This often includes Lean and throughput actions, footprint and labor alignment, SKU rationalization, and targeted cost takeout.
Focus Areas: Yield/quality | Labor productivity | Scheduling discipline | Footprint and flow | Fixed-cost reset | Make/buy and sourcing
The objective is rapid performance stabilization without disrupting customer delivery.
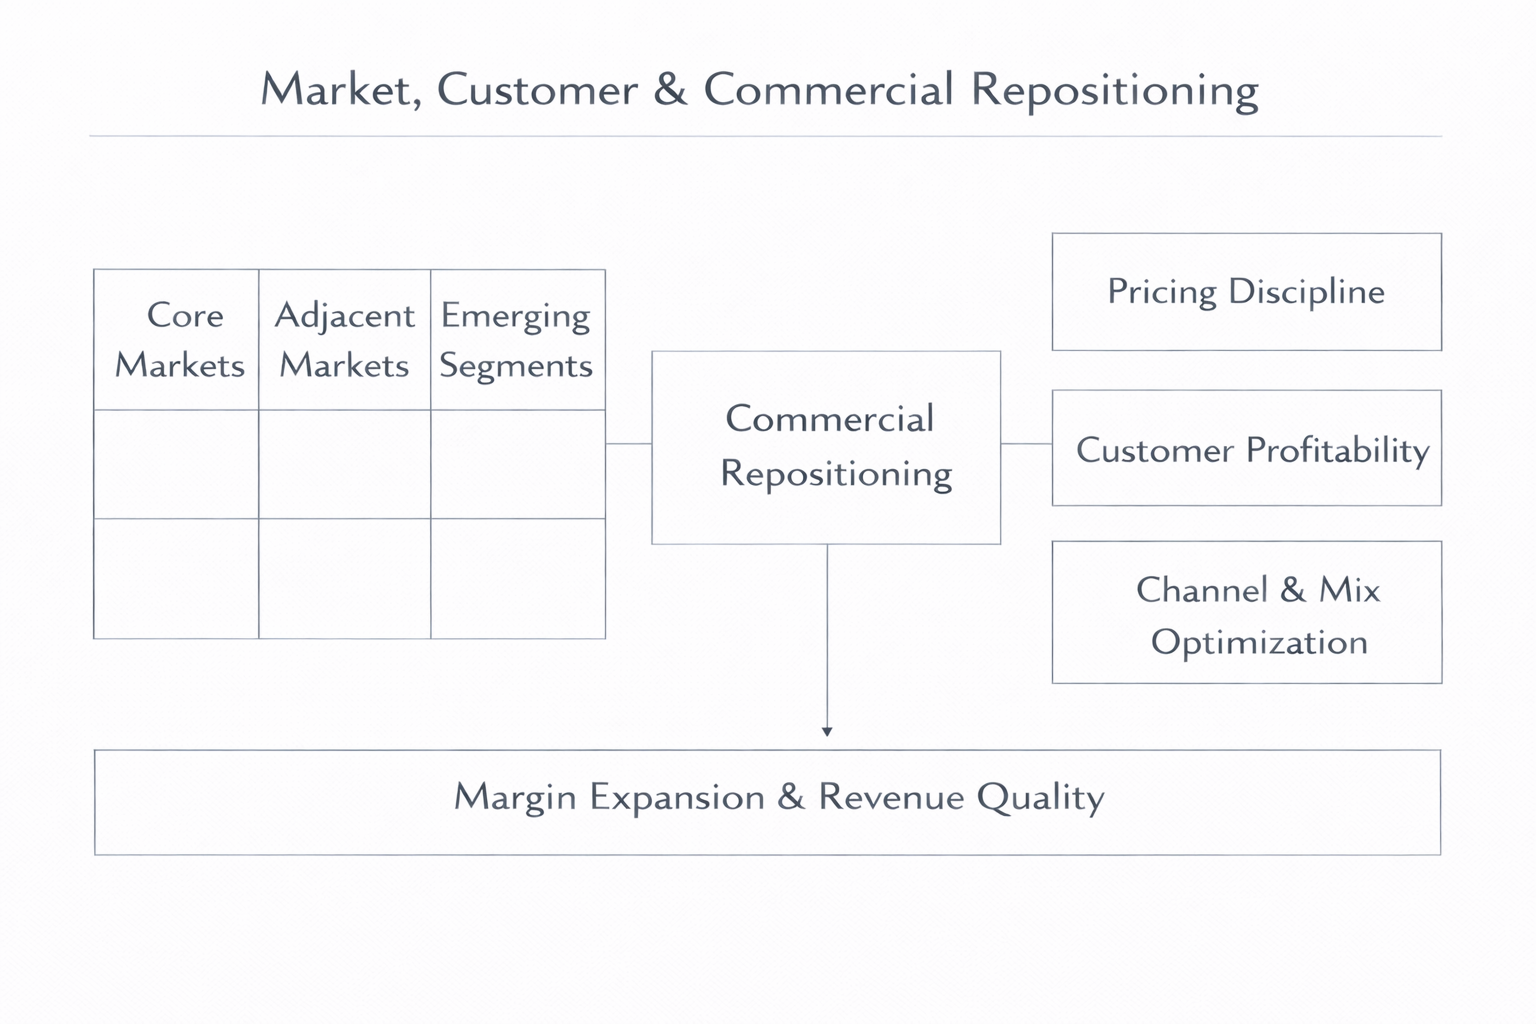
Market, Customer, and Commercial Repositioning
Turnarounds are not only internal. I pressure-test market positioning, pricing discipline, customer concentration, channel effectiveness, and product-market fit, then reset commercial priorities toward the segments where demand and margins are strongest.
Focus Areas:
Price and margin management | Customer profitability | Mix improvement | Pipeline quality | Strategic partnerships | Targeted new-market entry
Sustainable recovery requires commercial clarity, not just cost reduction.
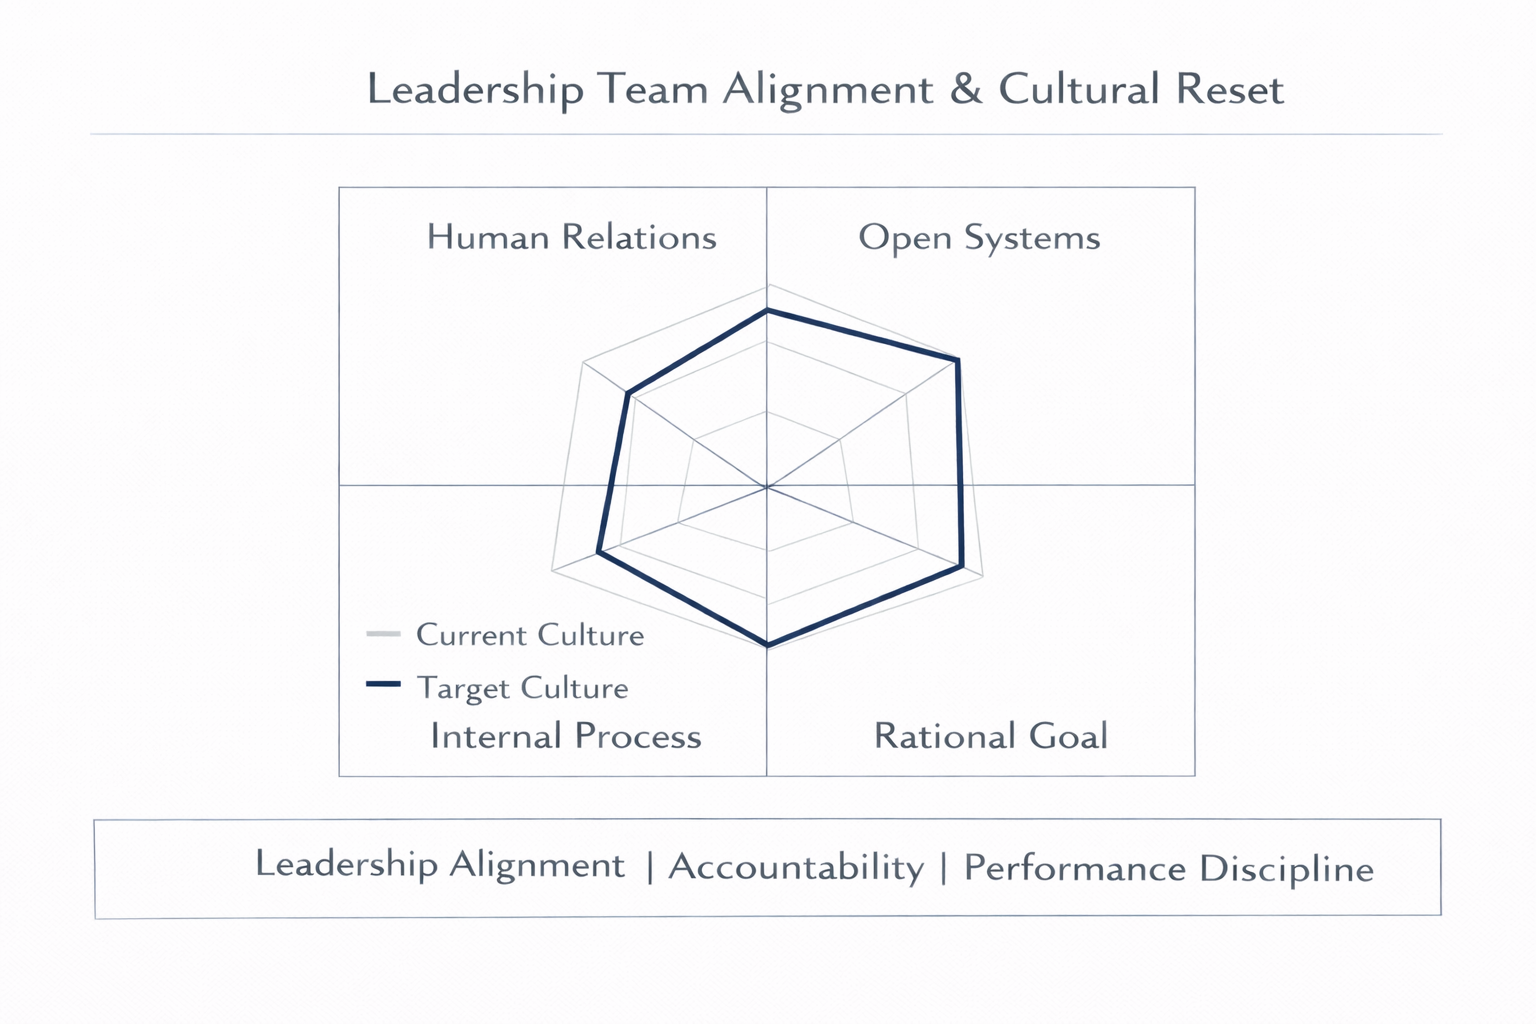
Leadership Team Alignment & Cultural Reset
Turnaround execution is a leadership test. I align decision rights, reset performance expectations, and establish a culture of accountability and continuous improvement. The Cultural Audit framework plugs directly into this step when cultural drift or subculture conflict is part of the root cause.
Focus Areas:
Right people in key roles | Clear accountability | KPI discipline | Communication cadence | Manager operating routines
Culture becomes a turnaround lever when it is defined, measured, and reinforced through leadership routines.
Monitoring & Course Correction
I install a tight operating cadence with a small number of critical KPIs and milestone tracking so issues are addressed early and performance does not drift.
Focus Areas:
Weekly KPI dashboard | Monthly sponsor reporting | Initiative tracking | Risk register and mitigation | Corrective-action follow-through
Turnaround success is protected through disciplined cadence and variance accountability.
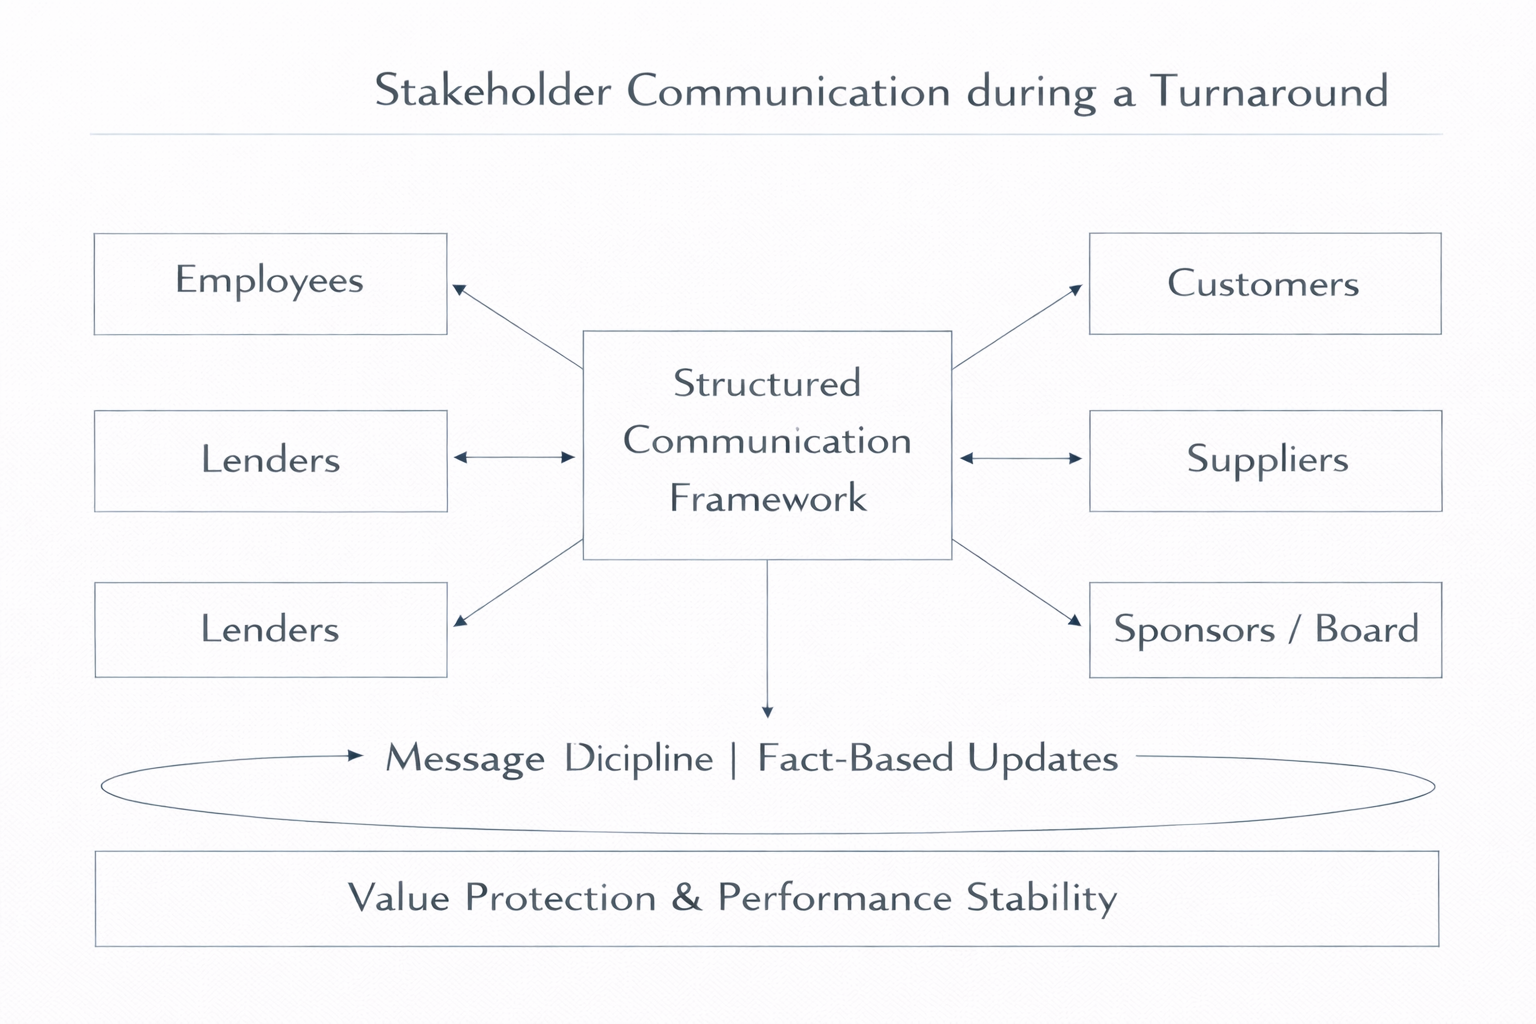
Stakeholder Communication
Turnarounds fail when stakeholders fill information gaps with assumptions. I establish consistent communication with employees, customers, suppliers, lenders, and sponsors to maintain confidence and preserve operating stability.
Focus Areas:
Stakeholder map | Message discipline | Fact-based updates | Confidence building | Escalation protocols
Transparent communication protects relationships and reduces execution friction.
Turnaround Outcome
The goal is not short-term stabilization alone, but the establishment of a durable operating system that supports profitable growth and exit readiness.
A successful turnaround creates a stronger business than the one that entered distress.